Skip to content
NAMEFRAMECommercial PreviewApply for Pilot
Coral Edge TPU

We trained on synthetic data only. The real-world test got worse.

A person detector trained on eight NameFrame captures and nothing else, run on a Coral USB Accelerator. Against the model it replaces it scores higher on our own held-out tiles, and on real drone footage its recall falls while its precision rises. Below is how each of those was measured, and what the misses have in common.

Trained on
8 synthetic captures, 0 real images
Training tiles
9,007 from 2,400 frames
Labelled boxes
63,742
Model
yolov5n · 1.77 M parameters
Runs on
Coral USB Accelerator (Edge TPU) · 2.1 MB
Outcome
Negative result

What this was trying to find out.

How far does synthetic-only training carry a small edge model, measured against real drone footage rather than against itself?

A small model is the honest test of training data. There is no capacity to hide a weak dataset behind and no room to memorise: a network of 1.77 M parameters, quantized to int8, either learned what a person looks like from above or it did not. So the model is the smallest thing that could work, and everything interesting is in the data it was given.

The measurement that matters is therefore not the score on our own validation split. It is the score on footage from a different world entirely: real drone frames, real streets, people the generator never placed. That is the number this page is organised around, and it is the one that got worse.

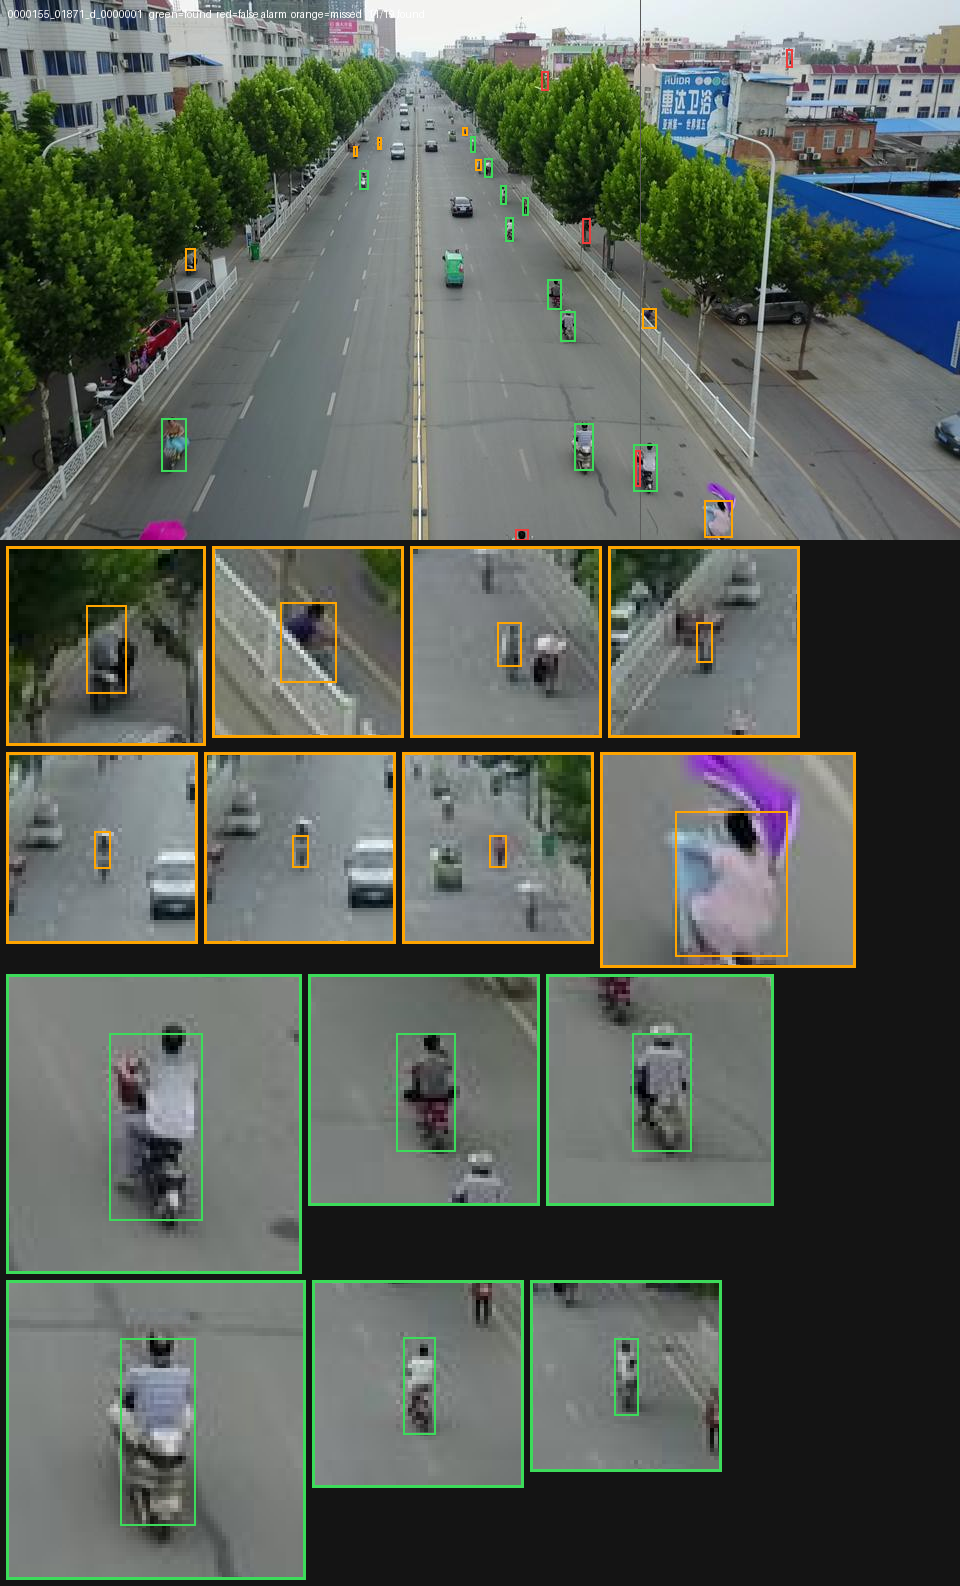
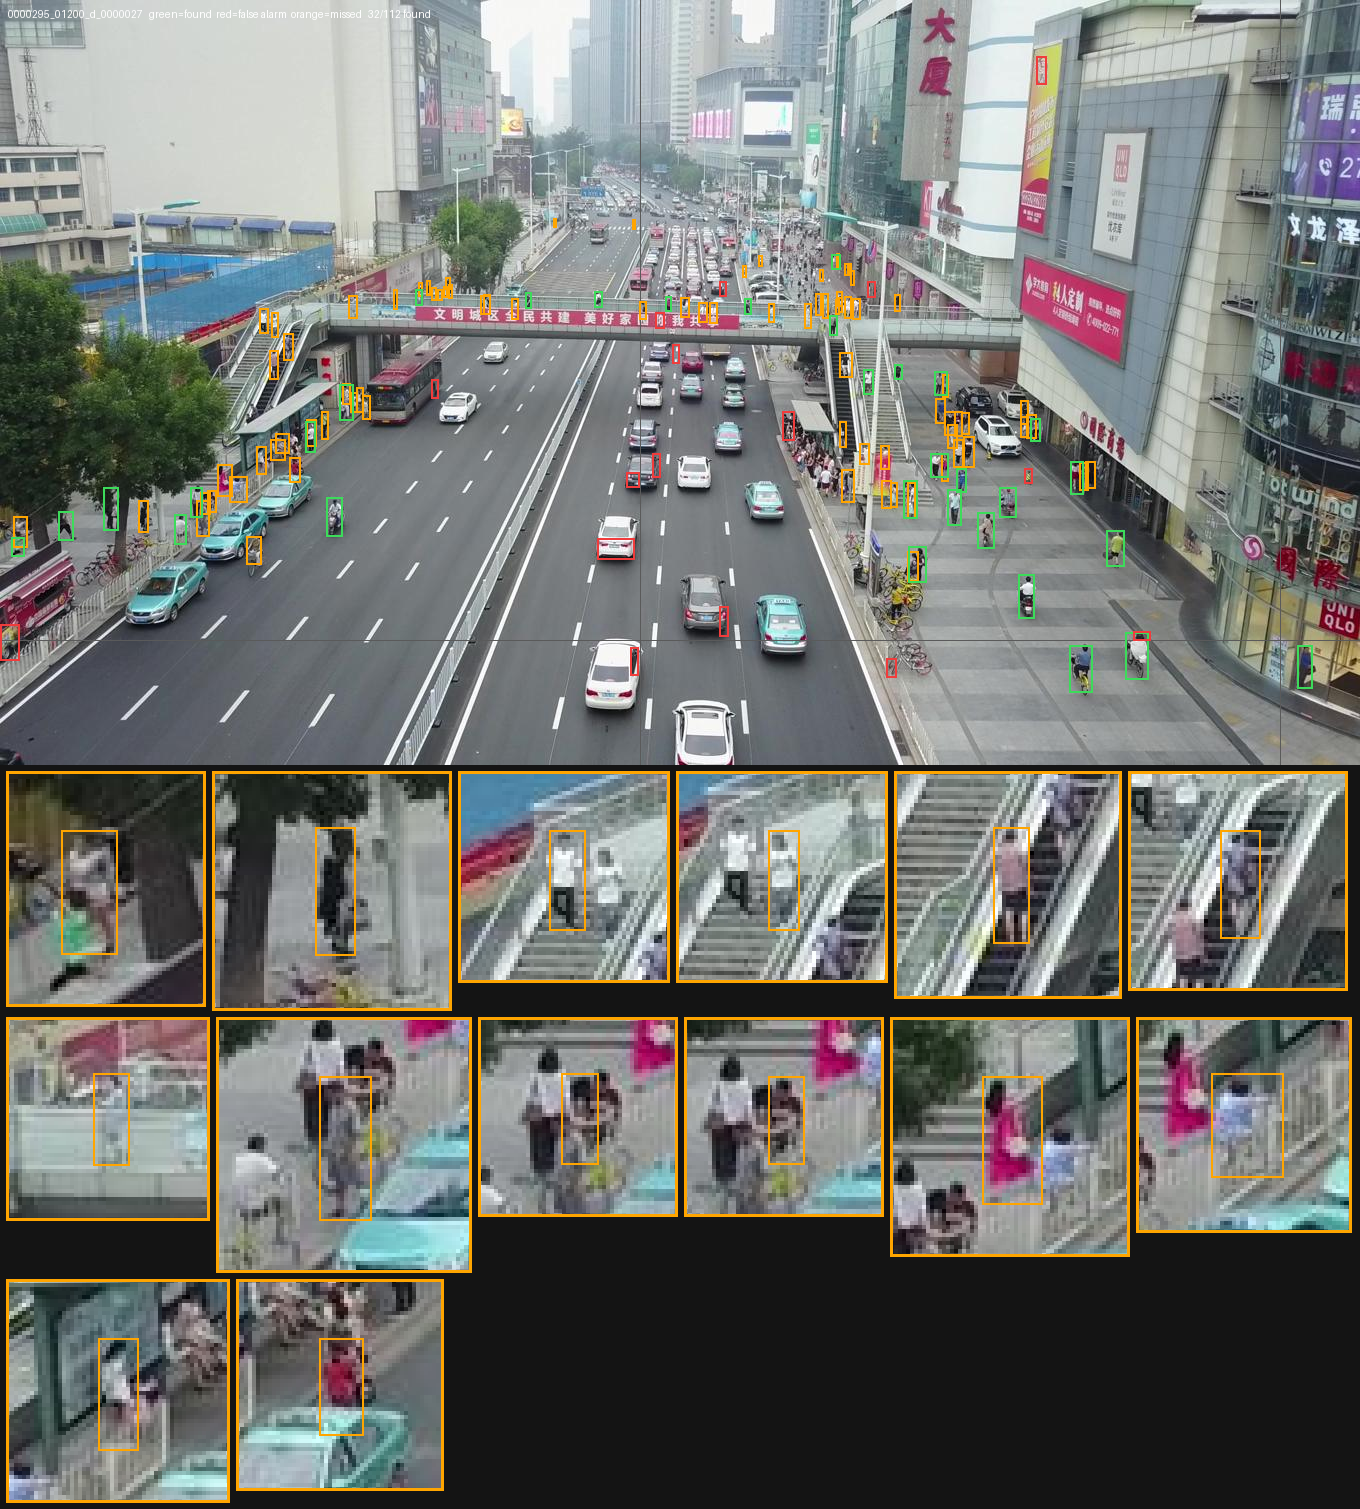
It is worth being precise about what “got worse” covers. On real footage, recall fell from 0.49 to 0.350 and precision rose from 0.52 to 0.582. The model finds fewer of the people who are there and is wrong less often about the ones it calls. Neither half of that is the whole story, and this page never reports one without the other.

0real images used in training

Not pre-training, not fine-tuning, not a mixed batch. Every one of the 9,007 training tiles was rendered in Unreal Engine by the generator this site is about, and every label came from the engine rather than from a person or a model. The VisDrone frames were used for measurement only, after training had finished.

The eight captures behind it.

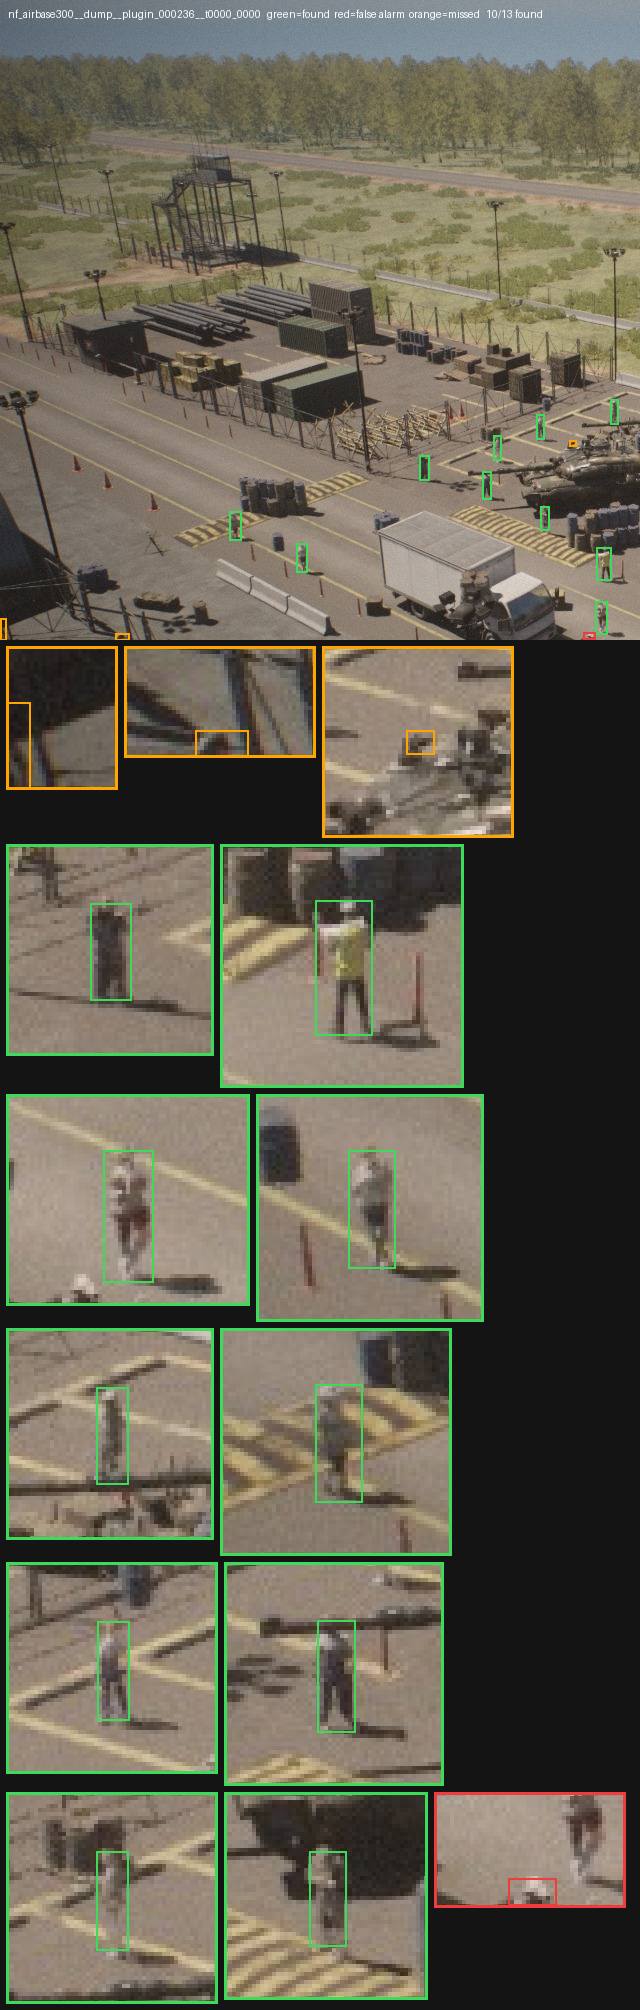
Each capture is 300 frames at 1280×960, shot through the viewport backend with a realistic_drone lens at 0.6. The instance counts are boxes rather than people: a person appears in as many frames as see them. Only the person boxes were kept as labels.

Eight captures · 2,400 frames · 63,742 person boxes after tiling
CaptureMapInstancesOf which personValidator grade, and what it validatedLabels at capture time
airbase300Airbase32,5467,921A 92.1on YOLOnot verifiable
beach300Beach22,0408,770B 80.7on YOLOnot verifiable
barnyard_gatefixBarnyard15,3697,434A 92.2on YOLOnot verifiable
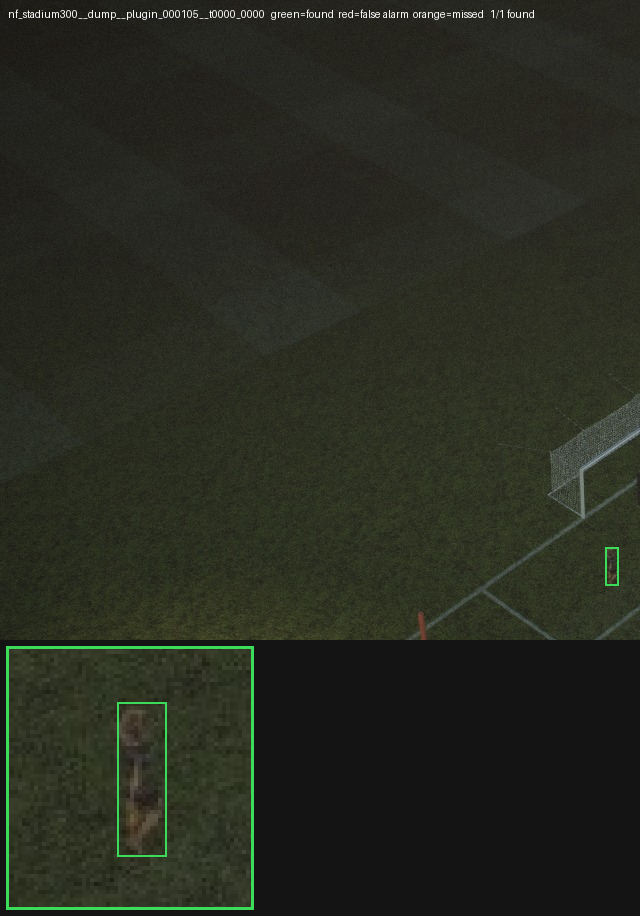
stadium300Football pitch, night12,9554,008A 93.9on YOLOdepth-tested
quarry300Quarry11,9215,609A 92.7on YOLOA 92.6also, on COCO + YOLOnot verifiable
prison300Prison yard11,4282,890A 93.5on YOLOdepth-tested
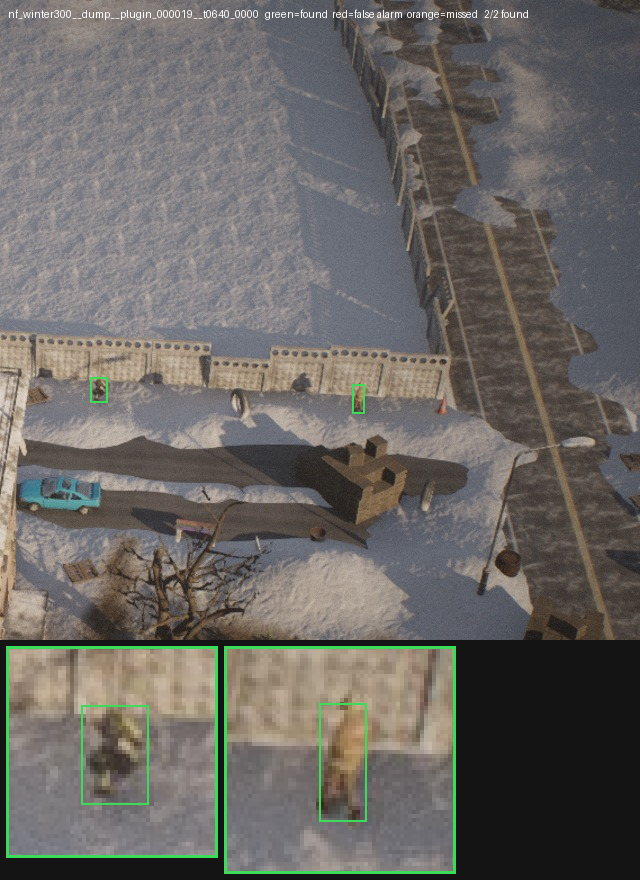
winter300Russian winter town7,7941,870A 93.3on YOLOnot verifiable
mv300Mountain village5,8922,470A 92.4on YOLOnot verifiable

A grade means nothing without the scope it was measured over, so the scope is in the column. All eight of these were validated over their YOLO export. Quarry is the one capture that was also validated over COCO and YOLO together, and that second run scores A 92.6 rather than A 92.7 — the same frames and the same labels, with a wider set of exports checked. Both numbers are correct. 92.6 is the one carried on the quality page, which is why both appear here rather than only the one this experiment happened to quote.

The last column is the caveat that belongs with this table. Two of these eight — prison300 and stadium300 — were captured after the segmentation pass was rewritten so that occlusion is decided by the GPU depth test rather than re-derived on the CPU. Those two are the only ones whose labels were verifiable at the moment they were written. The other six carry grades from the same validator, but the eight are not equally trustworthy at capture time and this page does not present them as if they were.

The pipeline, end to end.

Seven steps from a rendered frame to a detection on a USB stick. Two of them — how the tiles are cut, and where the decode lives — are the ones that decide whether any of the rest matters.

  1. 01NameFrame capturesEight maps, 300 frames each at 1280×960, realistic_drone lens at 0.6
  2. 02Person-only labelsEvery other class dropped from the labels and left unlabelled in the picture
  3. 03640 px tilesEach frame cut 2×2 at native resolution, splits grouped by camera zone
  4. 04yolov5n on RunPodOne class, 100 epochs, about 30 minutes on a single RTX 4090
  5. 05int8 export, raw headsGraph stopped at the three detection convolutions, decode left on the host
  6. 06edgetpu_compilerCalibrated on 377 tiles from this model's own validation split
  7. 07Coral USB Accelerator2.1 MB compiled, fully offloaded, decode in numpy on the host

One thing that is not a step: the decoys. Every capture contains barrels, crates, posts, bins and cones, and all of them are dropped from the labels while staying in the picture, unlabelled. A detector that sees an upright post in frame with no box on it learns that a post is not a person, which is exactly the confusion an aerial detector makes. The stadium capture was built for this specifically: 60 people in walk, run and stand poses, and 104 decoys chosen because they share a person’s silhouette from above — posts at 21×39 px against a person’s 18×38.

Three decisions that were already correct.

These are listed before the results on purpose. A bad number invites reaching for the nearest knob, and these three are the knobs nearest to hand — each of them was arrived at by getting it wrong first, and each measured clean here. Changing any of them in response to what follows would make the next result harder to read, not better.

  • Tiles at native scale, never downscaled

    What it does
    A frame is 1280×960 and the Edge TPU takes at most 640×640, so each frame is cut into four full-resolution tiles rather than shrunk to fit. The boxes are stitched back together and NMS is applied across the seams.
    Why it is not negotiable
    Downscaling a 1280×960 frame to 640 turns an 18 px person into 9 px. The training data has to be cut the same way inference cuts it, or the model learns the wrong size of person and the mistake never shows up as an error.
    What was measured
    Tile overlap is 0. A 20% overlap was measured and was worse: it added more duplicates at the seams than it recovered people cut in half.
  • Splits grouped by camera zone

    What it does
    Tiles go to train, val or test by the camera zone that produced their source frame, so two frames shot from the same orbit cannot land one in training and one in validation.
    Why it is not negotiable
    Frames from one orbit can be near-identical. Splitting them at random hands the model its own training images at validation time and every score comes back high.
    What was measured
    An earlier capture lost 11 points of grade to exactly this leak, which is how the rule was learned.
  • Calibration on this model's own data

    What it does
    The int8 scales were chosen by watching activations on 377 tiles drawn from this model's own validation split, not from a convenient pile of images.
    Why it is not negotiable
    Calibration decides the numeric range each tensor is quantized into. Images from a different set of maps measure the wrong ranges, and given what quantization does to this model, the ranges are the whole ball game.
    What was measured
    The export path was the one place a silent 15× drop in mAP50 was found and fixed, so nothing about it is treated as incidental.

The int8 trap, which decides whether there is a model at all.

Quantization to int8 is not a compression step here, it is the step that either preserves the model or destroys it, and it destroys it silently. Both exports below came from the same trained weights. Both compiled. Only one of them can detect a person.

The obvious export

One shared scale for everything

A plain export.py --int8 produces one output tensor holding normalised xywh, objectness and class score on a single quantization scale. Coordinates need headroom up to about 4.5; box dimensions live around 0.05. One scale has to cover both.

On this model that scale came out at 0.0176, so a 16 px person’s width survived as three quantization steps — and one step of error was 5.6 px. The model still runs. It still returns boxes. They are noise.

Shared quantization scale
0.0176
mAP50, before and after
0.78 → 0.05
Same graph exported to fp16
0.783
The export that works

Raw heads, decode on the host

Stop the graph at the three detection convolutions and do the sigmoid, grid and anchor decode in float on the host — a few hundred microseconds of numpy. Each head then gets its own scale, suited to the raw logits it actually holds.

The three head scales come out an order of magnitude coarser than the one that destroyed the shared export, because each is now scaled for its own contents. int8 then costs two points of recall instead of everything.

Per-head scales
0.157 · 0.216 · 0.201
Recall, float model
0.790
Recall, int8 on the TPU
0.767

The compiled model and its decode constants are a pair, not a file and an optional extra. -raw-int8_edgetpu.tflite is useless without -raw-decode.json: ship both or neither.

How we know it really ran on the TPU.

“Compilation succeeded” does not mean the model runs on the accelerator. A model can compile and then execute almost entirely on the CPU, at a tenth of the speed, with no error printed anywhere. Two checks, because the first one is easy to misread.

1. Count the operations

A fully offloaded model is one operation consuming the input and producing all three heads. The DELEGATE entry is bookkeeping pycoral adds; it is not a second op. A model that fell back to the CPU shows dozens of ordinary ones — 139, in the case this project hit.

from pycoral.utils.edgetpu import make_interpreter
it = make_interpreter("model_edgetpu.tflite")
it.allocate_tensors()
for op in it._get_ops_details():
    print(op["op_name"], op["inputs"], op["outputs"])

edgetpu-custom-op   inputs=[0]  outputs=[1, 2, 3]
DELEGATE            inputs=[0]  outputs=[1, 2, 3]

2. Take the delegate away

Load the compiled file with plain TensorFlow, without the Edge TPU delegate, and it fails at node 0. Node 0 being the custom op is the part that matters: it means nothing at all precedes it on the CPU, so there is no quiet prefix of ordinary operations running before the accelerator gets the tensor.

>>> tf.lite.Interpreter("model_edgetpu.tflite")
RuntimeError: Encountered unresolved custom op:
edgetpu-custom-op.
Node number 0 (edgetpu-custom-op) failed to prepare.

What it scores on our own data.

Measured on the Coral itself, not on a simulator: 244 tiles from camera zones the model never trained on.

int8 on the Edge TPU · 244 held-out tiles
Ground-truth boxes1,655
Found1,270
Missed385
False positives501
Recall0.767
Precision0.717

The float model, for reference

Before quantization, on its validation split at epoch 65: precision 0.944, recall 0.790, mAP50 0.888. Those are figures for our own synthetic data and they are not a claim about anything else.

Latency, measured on this setup: about 97 ms per inference pass, roughly 10 fps inference-only. An older run of the same model size measured 39 ms. The difference is probably USB 2.0 versus 3.0 — the accelerator wants 3.0 and works quietly slower on 2.0 — but that is unproven, and the USB link here was not controlled well enough to make this a hardware benchmark.

What it scores on real drone footage.

120 VisDrone frames, never seen in training, at two confidence thresholds. Lowering the threshold is the standard way to buy recall back; here it bought about two points.

VisDrone · 120 real frames · int8 on the Edge TPU
Confidence thresholdRecallPrecision
0.150.3500.582
0.100.3740.534
Against the model it replaces, at threshold 0.15
MeasurementPrevious modelThis model
mAP50, our synthetic split0.780.888
Recall, real footage0.490.350
Precision, real footage0.520.582

That right-hand table is the one most likely to be quoted out of context, so here is what is wrong with it. This model was measured on 120 real frames; the previous model was measured on 548. The two were trained with different tile sizes and different recipes, which makes this a comparison of two entire pipelines rather than of their training data. And nothing here separates the effect of the unlabelled decoys from the effect of the map mix — no experiment was run to do that. Treat the direction as indicative and the magnitudes as unproven.

Better on our own data. Worse on the footage that matters.

  • 0.888previous model 0.78mAP50 on our own synthetic validation split. Up, and it is the measurement that counts for least.
  • 0.350previous model 0.49Recall on 120 real drone frames. Down by a third: it finds fewer of the people who are actually there.
  • 0.582previous model 0.52Precision on the same real frames. Up: when it does call a person, it is right more often.

Three numbers, three directions, and no single sentence covers them. The model got better at our own data, worse at finding real people, and better at not inventing them. It set out to transfer to real footage and it transferred less well than what it replaced, which makes this a failure at its stated goal — with the caveats above still attached: 120 frames against 548, two pipelines that differ in more than their data, and no experiment isolating the decoys from the map mix.

What the failures have in common.

The gap is in the data, not in the training or the export: both of those measured clean. Ranked by expected effect — what we would change first, and why each one is a property of how the frames were generated rather than of how the model was trained.

  1. People must touch things

    The spawner places people on open ground with a minimum separation, so the model learned an isolated silhouette. VisDrone people stand next to railings, between cars, under trees, against walls. Placement has to put people adjacent to and partially occluded by scene objects, not merely near them.

  2. Groups and crowds

    MinSpacingM is 0.5 m and every person is a separate placement. Real aerial footage is full of clusters where silhouettes touch and overlap. Some fraction of placements should be authored as groups with sub-metre spacing, sharing a heading.

  3. Urban ground cover

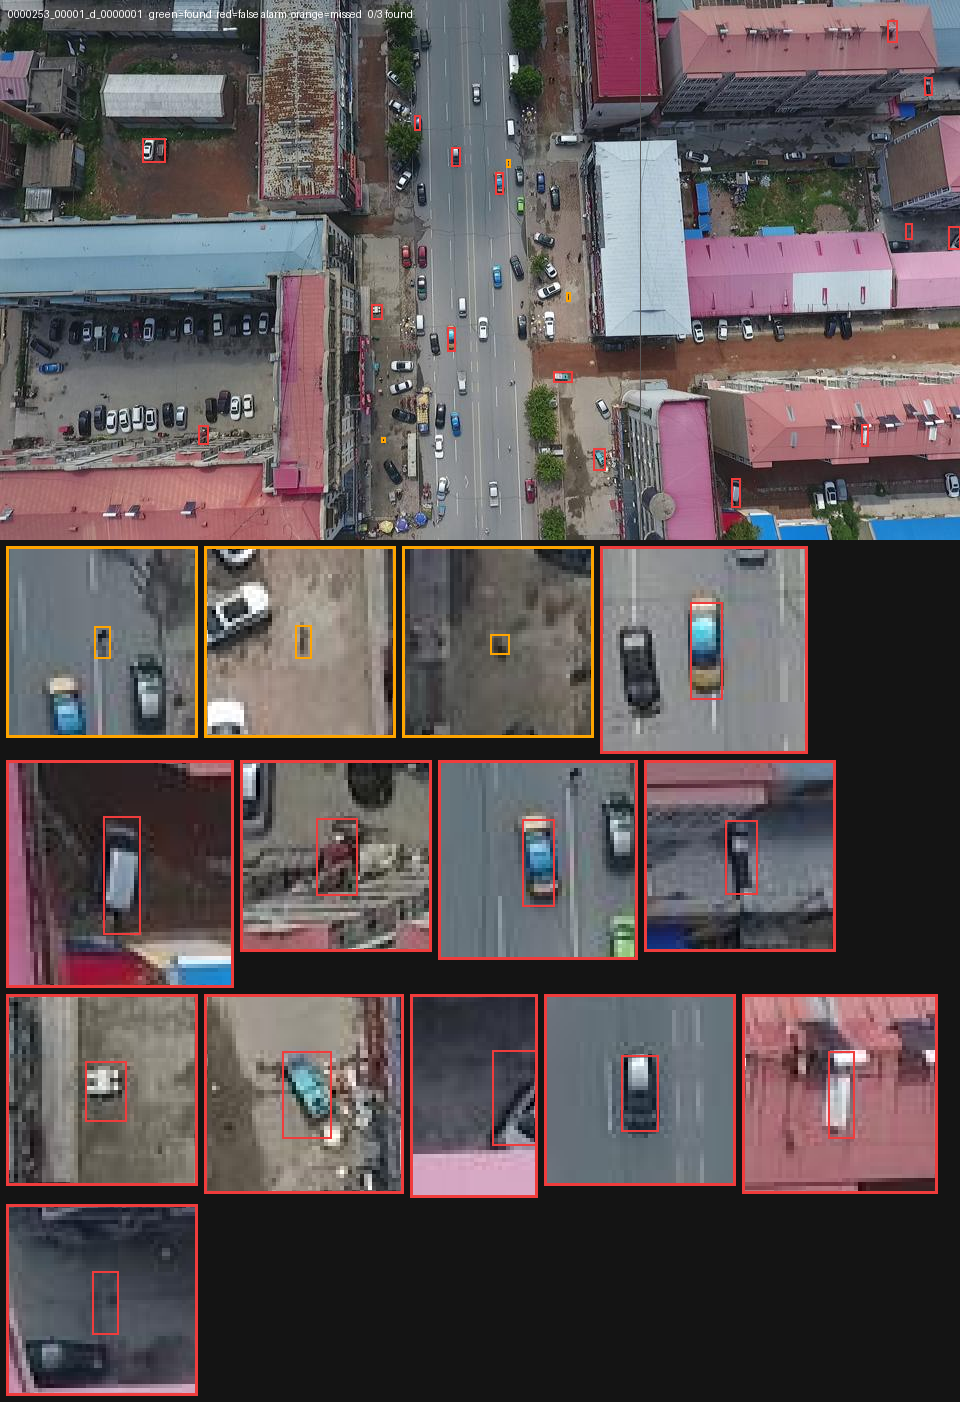
    The eight maps are strong on environment variety — snow, night, quarry, beach — and weak on the one thing VisDrone is made of: streets with pavements, parked cars, road markings, street furniture. The previous model's seven captures included more of this, which is a plausible part of why it transferred better.

  4. Pose variety beyond three states

    The stadium capture used walk, run and stand only, which was right for that experiment and narrow in general. Real footage has people carrying things, pushing bicycles, standing in doorways, sitting on steps.

  5. Character variety

    111 distinct characters exist and 50 are used per map. A real crowd has far more appearance variation than 50 repeated models, and repeated identities across 2 400 frames are an invitation to overfit.

  6. The seven older captures that were left out

    Training on the eight new sets alone discards seven older ones. They predate the occlusion fix and may carry some phantom labels, but they contain scene types the new ones lack.

What we are not changing blindly.

A bad number is an invitation to change things until it improves, and most of the available changes here would improve the number by making the task easier. These four stay as they are until there is a measurement that says otherwise.

Person size, which is already right
Person size across the eight sets has a median of 19.7 px, with 91% under 32 px. That is genuinely VisDrone-like and it is the one axis that needs no work. The obvious reaction to a bad recall number is to fly the camera lower until people are big enough to detect, which would improve the score by making the task easier and destroy the only property of this data that already matches the target domain.
The export path
The raw-head export is the difference between a working model and one at mAP50 0.05. It measured clean and it is not being touched while the data is under investigation.
Tiling, split grouping and calibration
All three measured correct. The gap is in the data, not in the training or the export, and changing a part that already works only makes the next result harder to read.
The assumption that mixing the old captures back in would help
It might. It is also possible their pre-fix labels hurt more than their scene variety helps. That is a measurement to run both ways, not a conclusion to act on.

What this experiment does not show.

Everything that makes the numbers above weaker than they look, collected in one place rather than distributed through the page where it is easy to miss.

  • The real-footage numbers come from 120 VisDrone frames. The previous model's came from 548. That is a difference in sample size large enough to matter on its own, and it means the two columns are indicative rather than a controlled comparison.
  • The two models were trained with different tile sizes and different recipes, so "higher on synthetic, lower on real" compares two whole pipelines, not the training data alone. No part of this isolates the data as the cause.
  • No experiment separated the effect of the unlabelled decoys from the effect of the map mix. The precision gain and the recall loss are consistent with the decoys making the model more conservative, but consistent is not demonstrated.
  • Lowering the confidence threshold from 0.15 to 0.10 recovered only 2 points of recall, which argues the model genuinely does not see those people rather than merely doubting them. That is evidence against the conservatism explanation, and it is left standing rather than explained away.
  • Only two of the eight captures — prison300 and stadium300 — were shot after the segmentation pass began deciding occlusion from the GPU depth test. The other six have labels that were not verifiable at capture time.
  • Latency was measured on this setup, not on a controlled one: about 97 ms per inference pass here against 39 ms recorded previously for the same model size. The likely cause is USB 2.0 versus 3.0, and it was not proven either way.

Source of record: docs/CORAL_EDGE_TPU.md at commit be0bb8d. Published 2026-08-17. Every figure on this page is in that document, with one addition: the second Quarry grade, A 92.6 over COCO and YOLO, comes from that capture’s own validator output and is the figure the rest of the site publishes. Nothing here was recomputed, rounded or restated for the web.

Run this against your own footage.

The useful thing about a result like this is that it is specific: this data, in this mix, for this domain. Your domain is not aerial Chinese streets, and the gaps that hurt here may not be the gaps that hurt you. Tell us the classes, the conditions and the volume, and the same generator produces a capture aimed at your target footage — with the same discipline about what a number does and does not show.